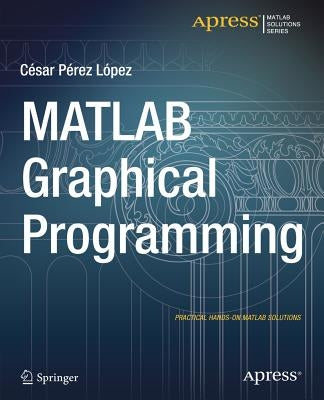
Description
MATLAB enables you to work with its graphics capabilities in almost all areas of the experimental sciences and engineering. The commands that MATLAB implements in job related graphics are quite useful and are very efficient.
MATLAB has functions for working with two-dimensional and three-dimensional graphics, statistical graphs, curves and surfaces in explicit, implicit, parametric and polar coordinates. It also works perfectly with twisted curves, surfaces, volumes and graphical interpolation. MATLAB Graphical Programming addresses all these issues by developing the following topics: This book is a reference designed to give you a simple syntax example of the commands and to graph it so that you can see the result for:
Author: Cesar Lopez
Publisher: Apress
Published: 12/22/2014
Pages: 208
Binding Type: Paperback
Weight: 0.81lbs
Size: 9.25h x 7.50w x 0.44d
ISBN13: 9781484203170
ISBN10: 1484203178
BISAC Categories:
- Computers | Computer Science
- Computers | Software Development & Engineering | General
- Computers | Languages | General
About the Author
César Perez Lopez is a Professor at the Department of Statistics and Operations Research at the University of Madrid. César Perez Lopez is also a Mathematician and Economist at the National Statistics Institute (INE) in Madrid, a body which belongs to the Superior Systems and Information Technology Department of the Spanish Government. César also currently works at the Institute for Fiscal Studies in Madrid.
This title is not returnable

