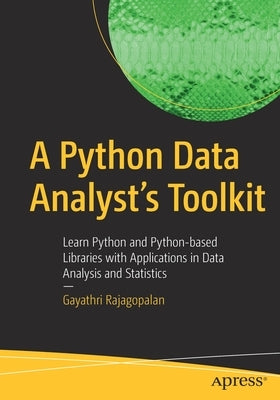
Description
Chapter 1: Introduction to Python [25 pages]Description: Python is one of the most popular open-source programming languages and is easy to learn as well. Topics to be covered: 1. Installation - how to install Python and Anaconda2. Using Jupyter notebooks3. Data types in Python4. Loops and conditional statements5. Functions6. Strings and their methods7. PEP(Python Enhancement Proposal) guidelines8. Sympy library and solving mathematical problems with Python Chapter 2: Exploring Containers, Classes & Objects, and Working with Files [25 pages]Description: Understanding data structures, classes and objects and file handling in Python.Topics to be covered: 1. Lists2. Tuples3. Dictionaries4. Sets5. Classes and Objects6. Working with files Chapter 3: Regular Expressions [20 pages]Description: Regular expressions are important to understand as they have a wide range of applications, from natural language processing to working with files to manipulating stringsTopics to be covered: 1. Introduction to regular expressions2. Meta-characters3. Python functions for regular expressions4. Matching characters and sub-expressions5. Using conditions for matching Chapter 4: Data Analysis Basics [10 pages]Description: In this chapter, we will cover the basic terminology in data analysis and the data analysis workflowTopics to be covered: 1. Basic concepts and definitions2. Levels of data3. Data analysis workflow Chapter 5: Numpy Library [10 pages]Description: The Numpy library will be explained in detail.Topics to be covered: 1. Introduction2. Creating arrays3. Slicing and dicing4. Array manipulations
Chapter 6: Data Wrangling with Pandas [50 pages]Description: Everything related to Pandas, a widely used library used for manipulating and analyzing dataTopics to be covered: 1. Introduction2. Series and their methods/functions3. DataFrames and their methods/functions4. Grouping and Aggregation5. Merging objects6. Tidying data Chapter 7: Data Visualization [20 pages]Description: An introduction to data visualization, which is crucial for and conveying insights to a new audienceTopics to be covered: 1. Introduction2. Types of plots3. Creating plots with the Matplotlib library4. Using the Pandas library for drawing graphs5. Visualization with the Seaborn library Chapter 8: Case Studies [60 pages]Each case study will start with an overview of the dataset, followed by an in-depth analysis of data that includes data tidying, wrangling, and visualization. The case study would conclude with cr
Author: Gayathri Rajagopalan
Publisher: Apress
Published: 12/23/2020
Pages: 399
Binding Type: Paperback
Weight: 1.60lbs
Size: 10.00h x 7.00w x 0.86d
ISBN13: 9781484263983
ISBN10: 1484263987
BISAC Categories:
- Mathematics | Probability & Statistics | General
- Computers | Languages | Python
About the Author
Gayathri Rajagopalan works for a leading Indian multi-national organization, with ten years of experience in the software and information technology industry. A computer engineer and a certified Project Management Professional (PMP), some of her key focus areas include Python, data analytics, machine learning, and deep learning. She is proficient in Python, Java, and C/C++ programming. Her hobbies include reading, music, and teaching data science to beginners.

